Profit analytics for Temu sellers
Temu tells you what you sold.
MarginPanel tells you what you kept.
Upload the settlement report from Seller Central and see your real profit by month, by day and by SKU, after shipping labels, refunds, ads and product cost.
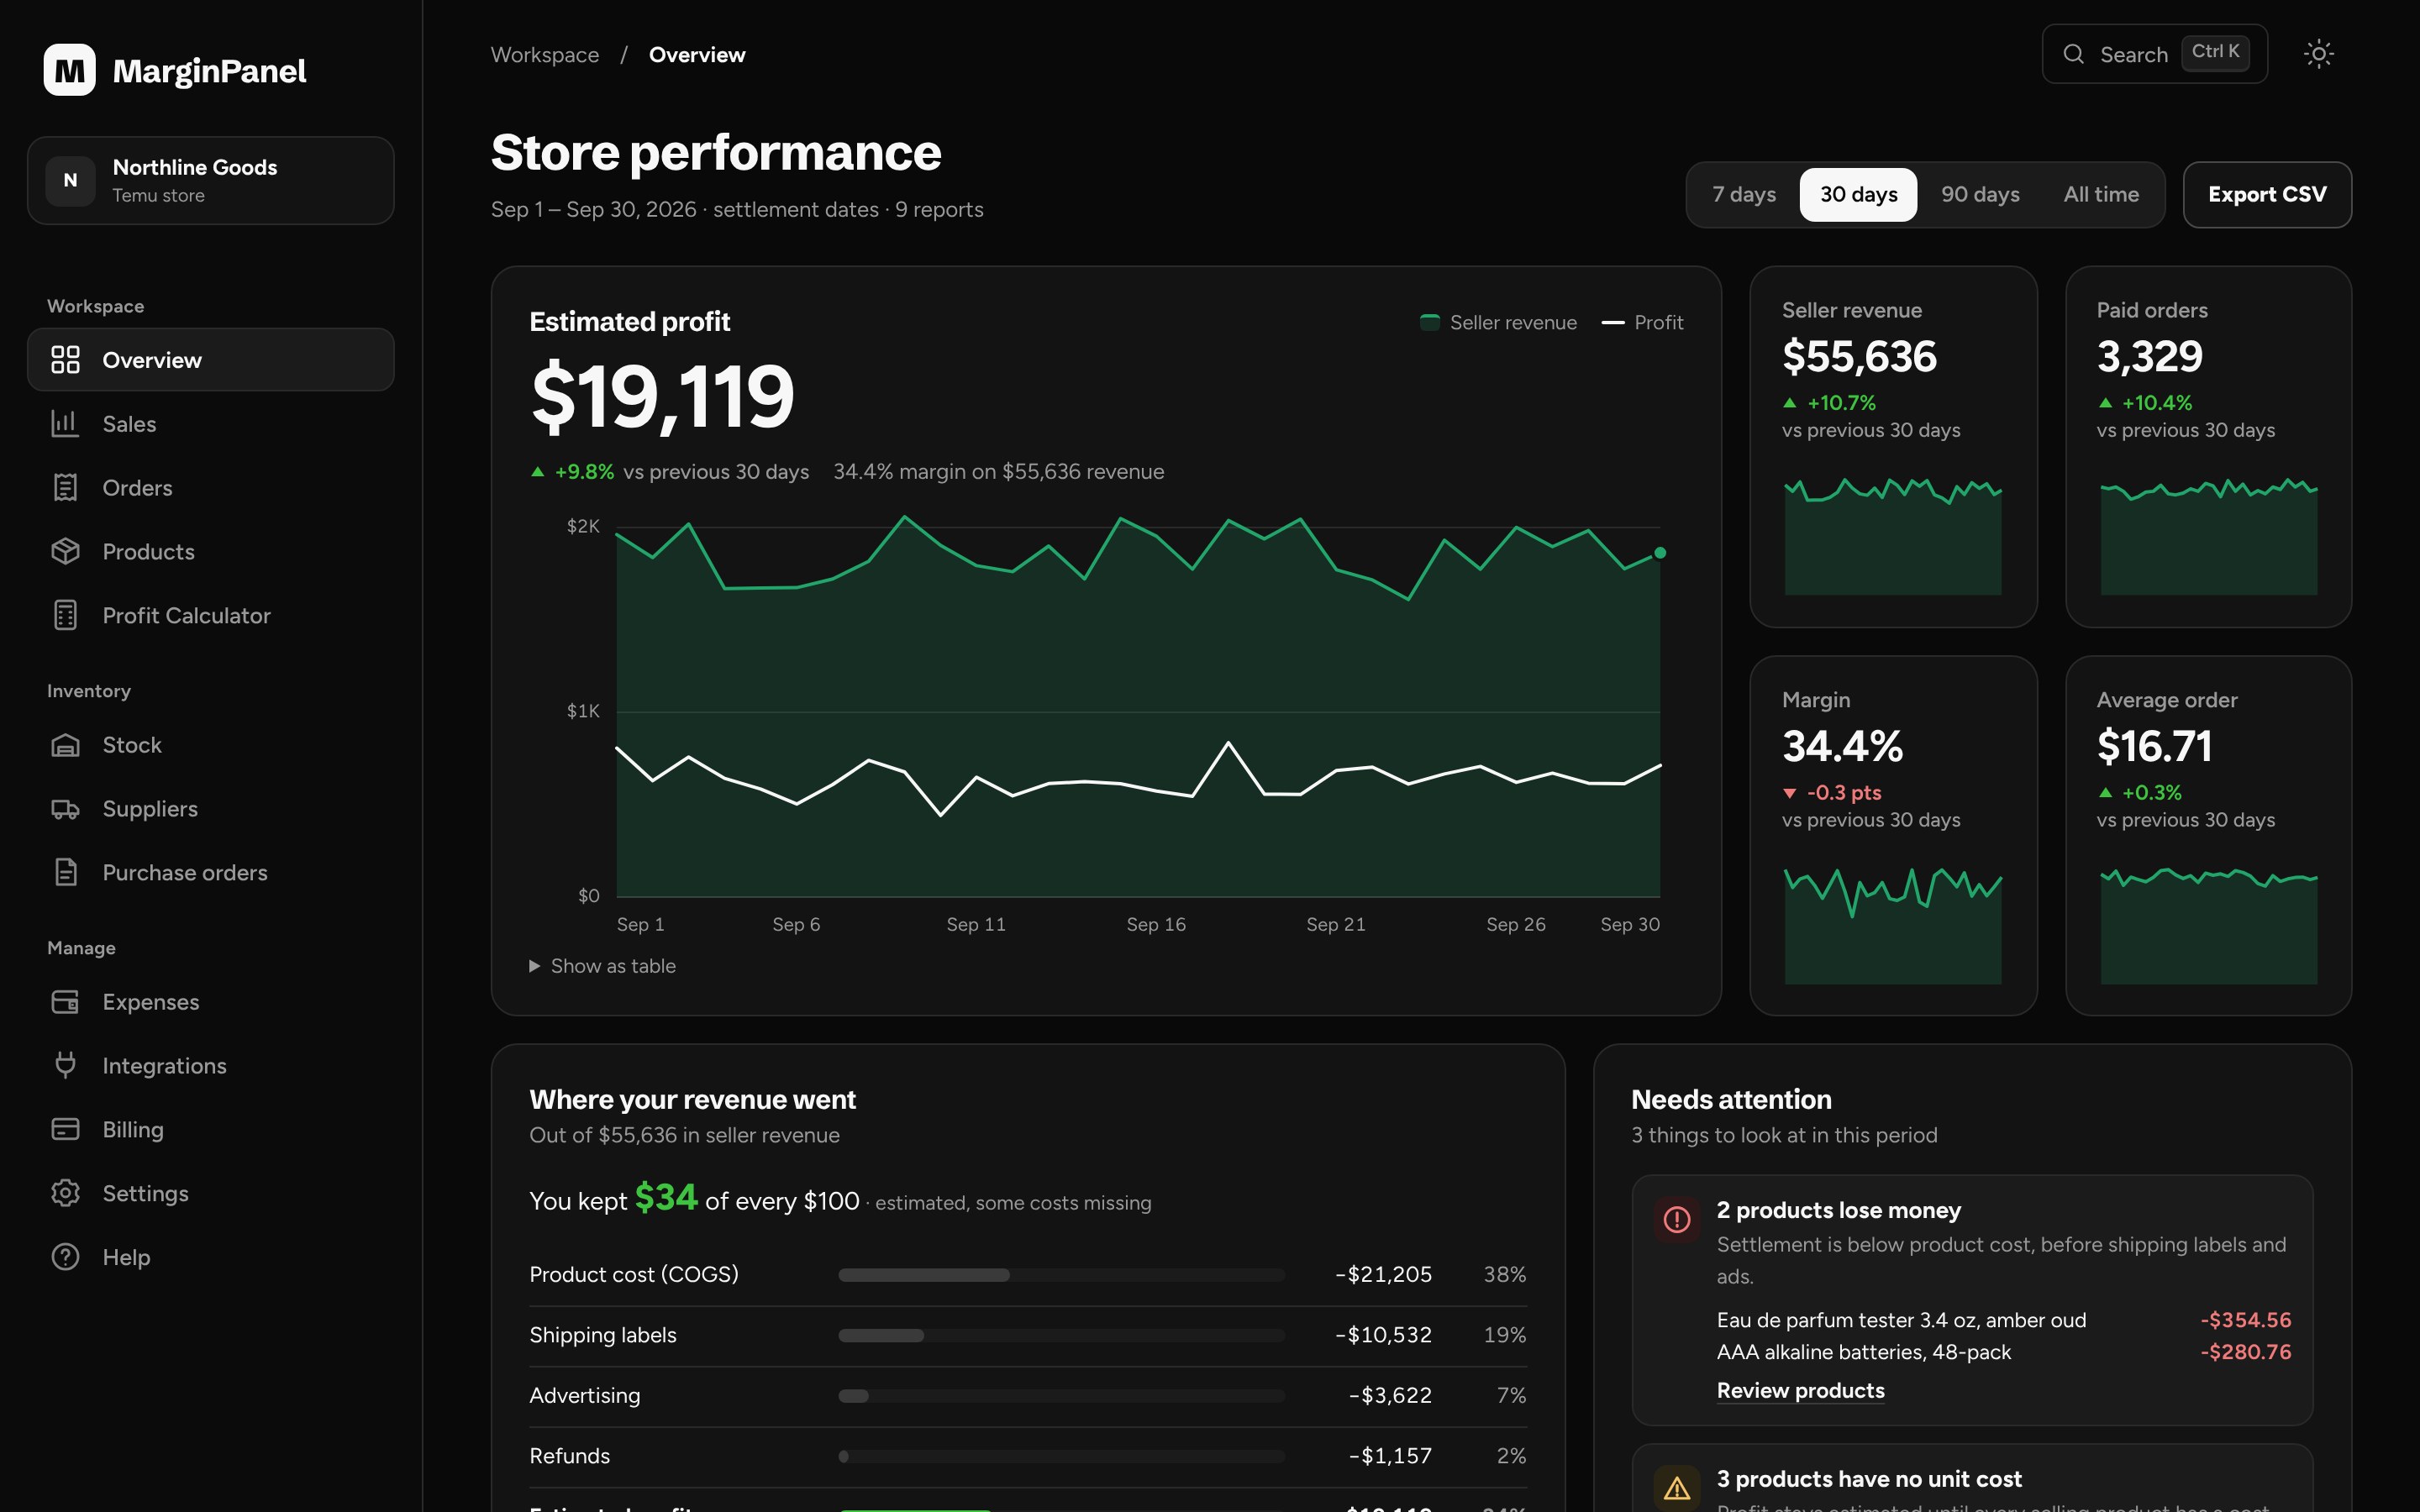
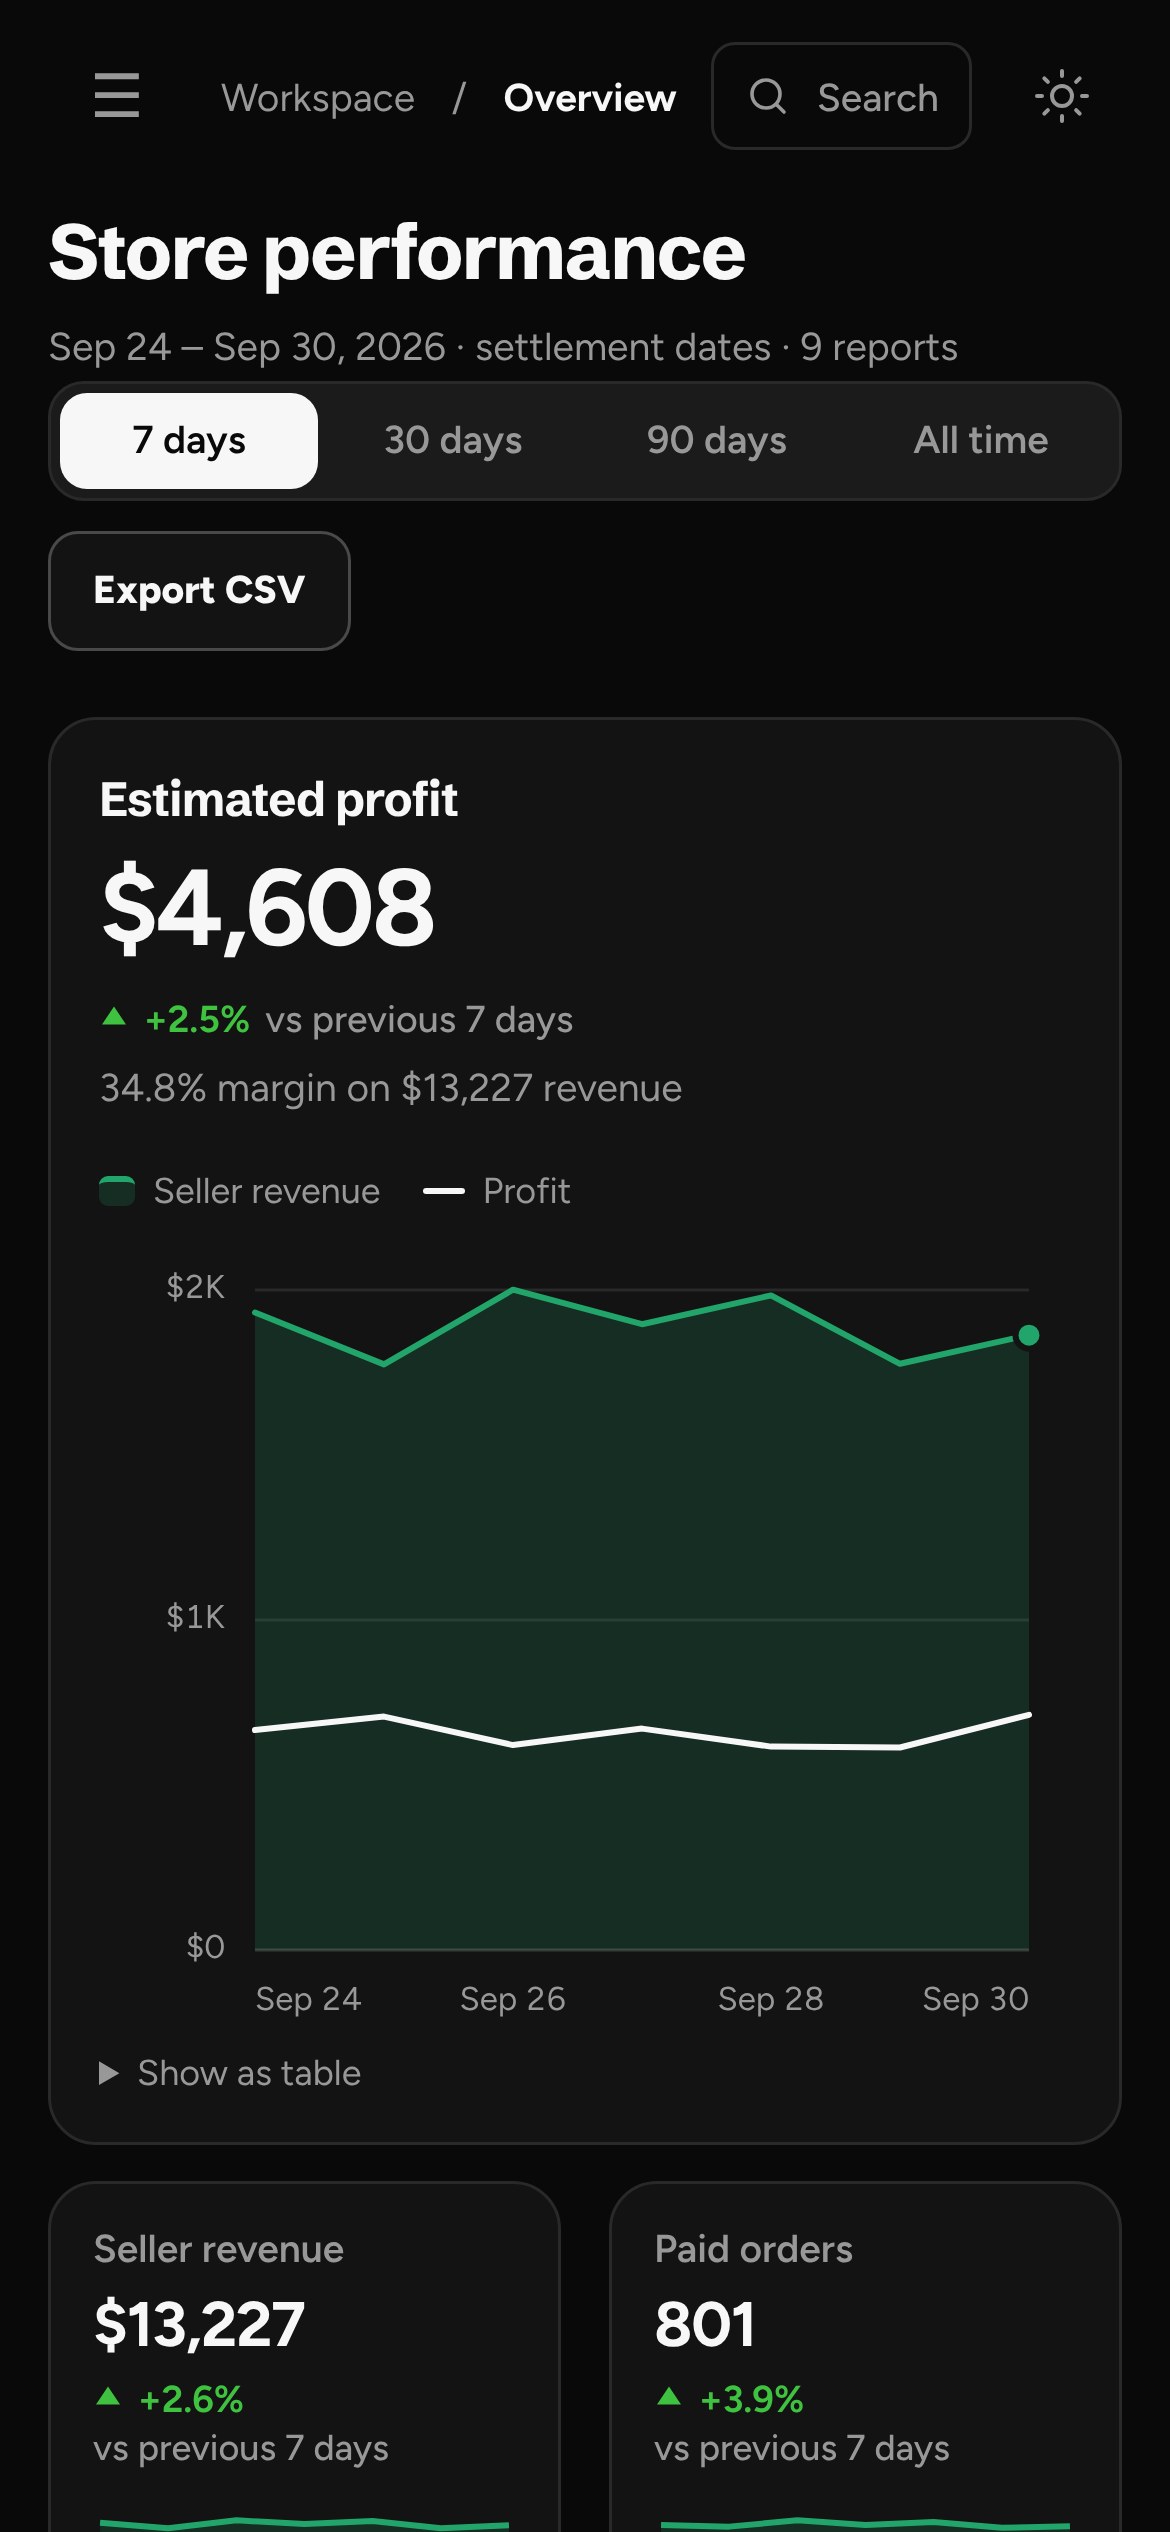
Real screenshots of the app with a demo store.
THE PROBLEM
Sales look great. Profit is a different story.
Temu pays by settlement, not by order
One month is thousands of rows: payments, labels, refunds, adjustments, ads and transfers, all mixed in one file.
Shipping labels are charged separately
Label costs land on other lines of the report. If you only look at sales, you never subtract them from the product that caused them.
A SKU can sell a lot and still lose money
Without a cost per product, you can’t tell which ones carry you and which ones drag you down.
REAL CASE · OUR OWN TEMU STORE
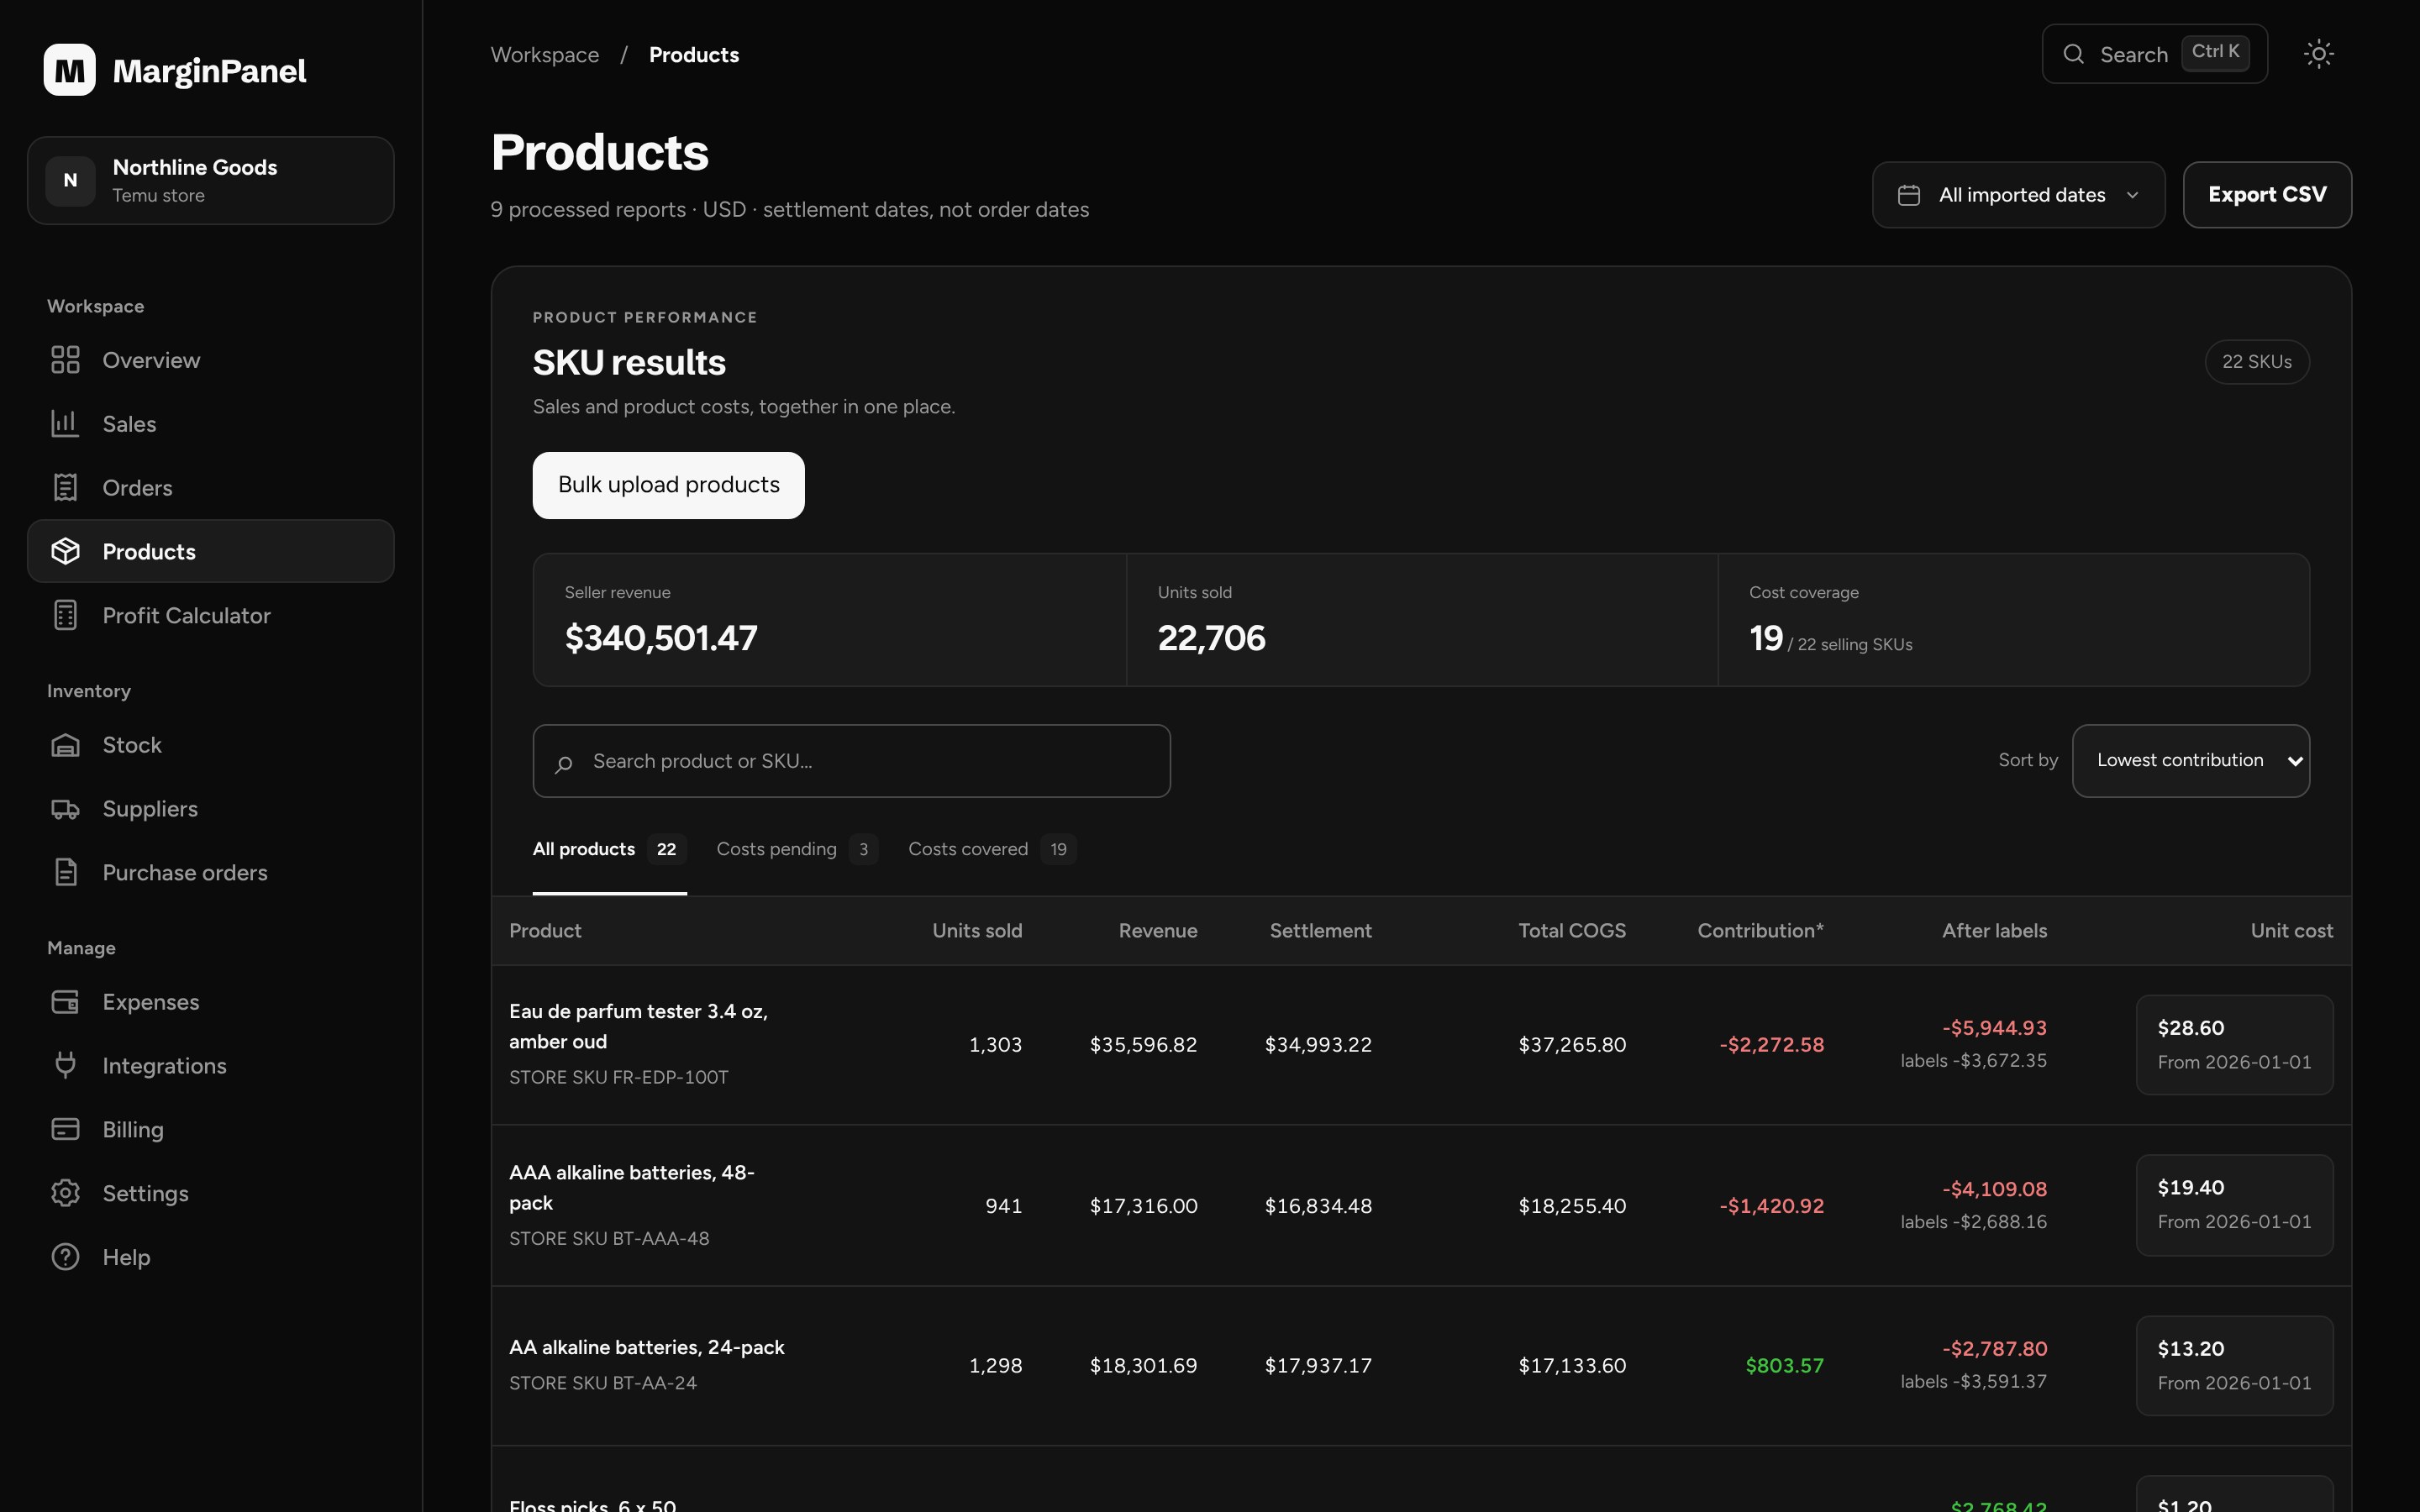
One perfume tester, January to September 2026
After shipping labels, that SKU was losing money. By sales, it looked like a winner. We saw it the day we added its product cost in MarginPanel.
HOW IT WORKS
From raw report to P&L in three steps.
Download your report
The same one you already pull from Seller Central. Pick the date range and export.
→ Finance
→ Reports / Statements
→ Export
Upload it to MarginPanel
CSV or Excel, several months at once. It processes automatically and flags repeated files and overlapping months.
Add your cost per SKU
One at a time or paste up to 200 at once, each with an effective date. Profit recalculates instantly.
THE APP
Everything you need to find out what actually makes you money.
See where every dollar went, and what to check first.
The Overview shows how much you kept out of every $100 in sales and flags what’s urgent: products losing money, SKUs without a cost and margins under 10%.
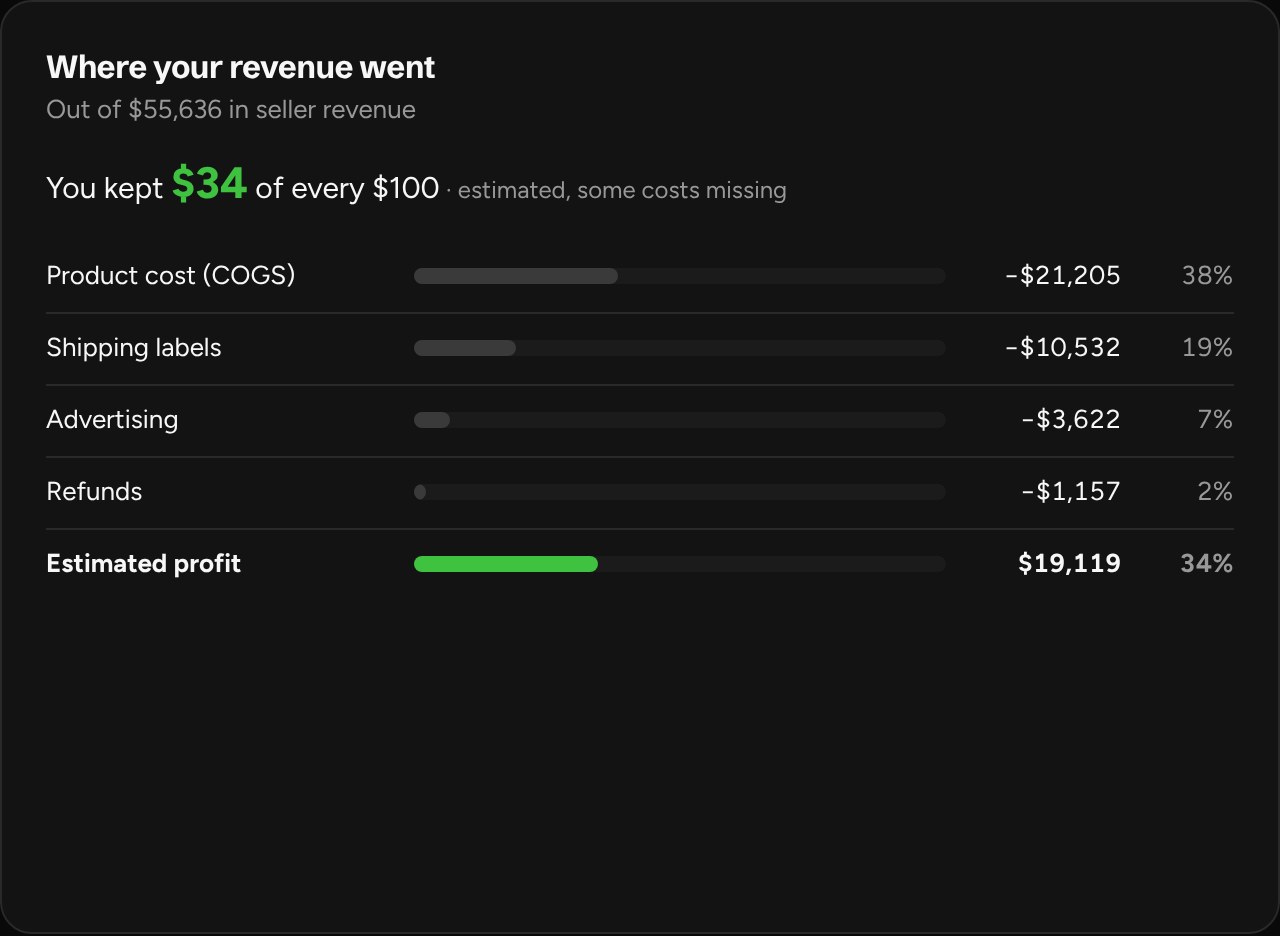
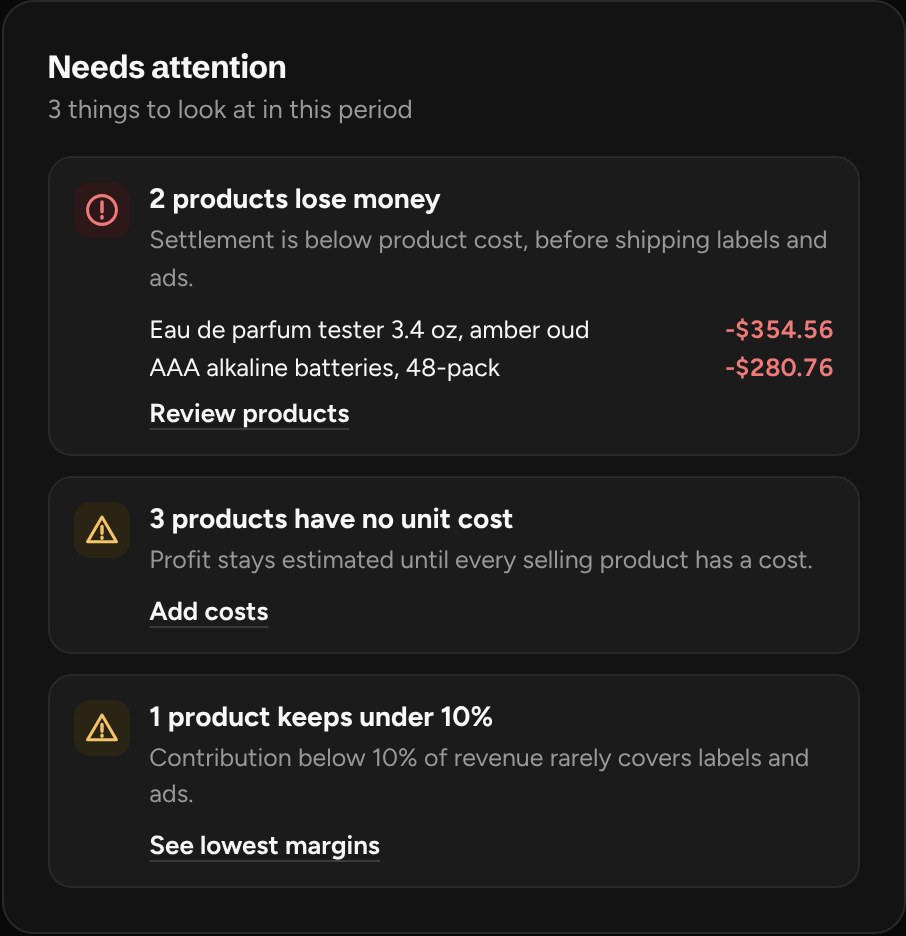
Find the SKUs that lose money.
Sales, settlement, product cost and what’s left after shipping labels, for every product in one table.
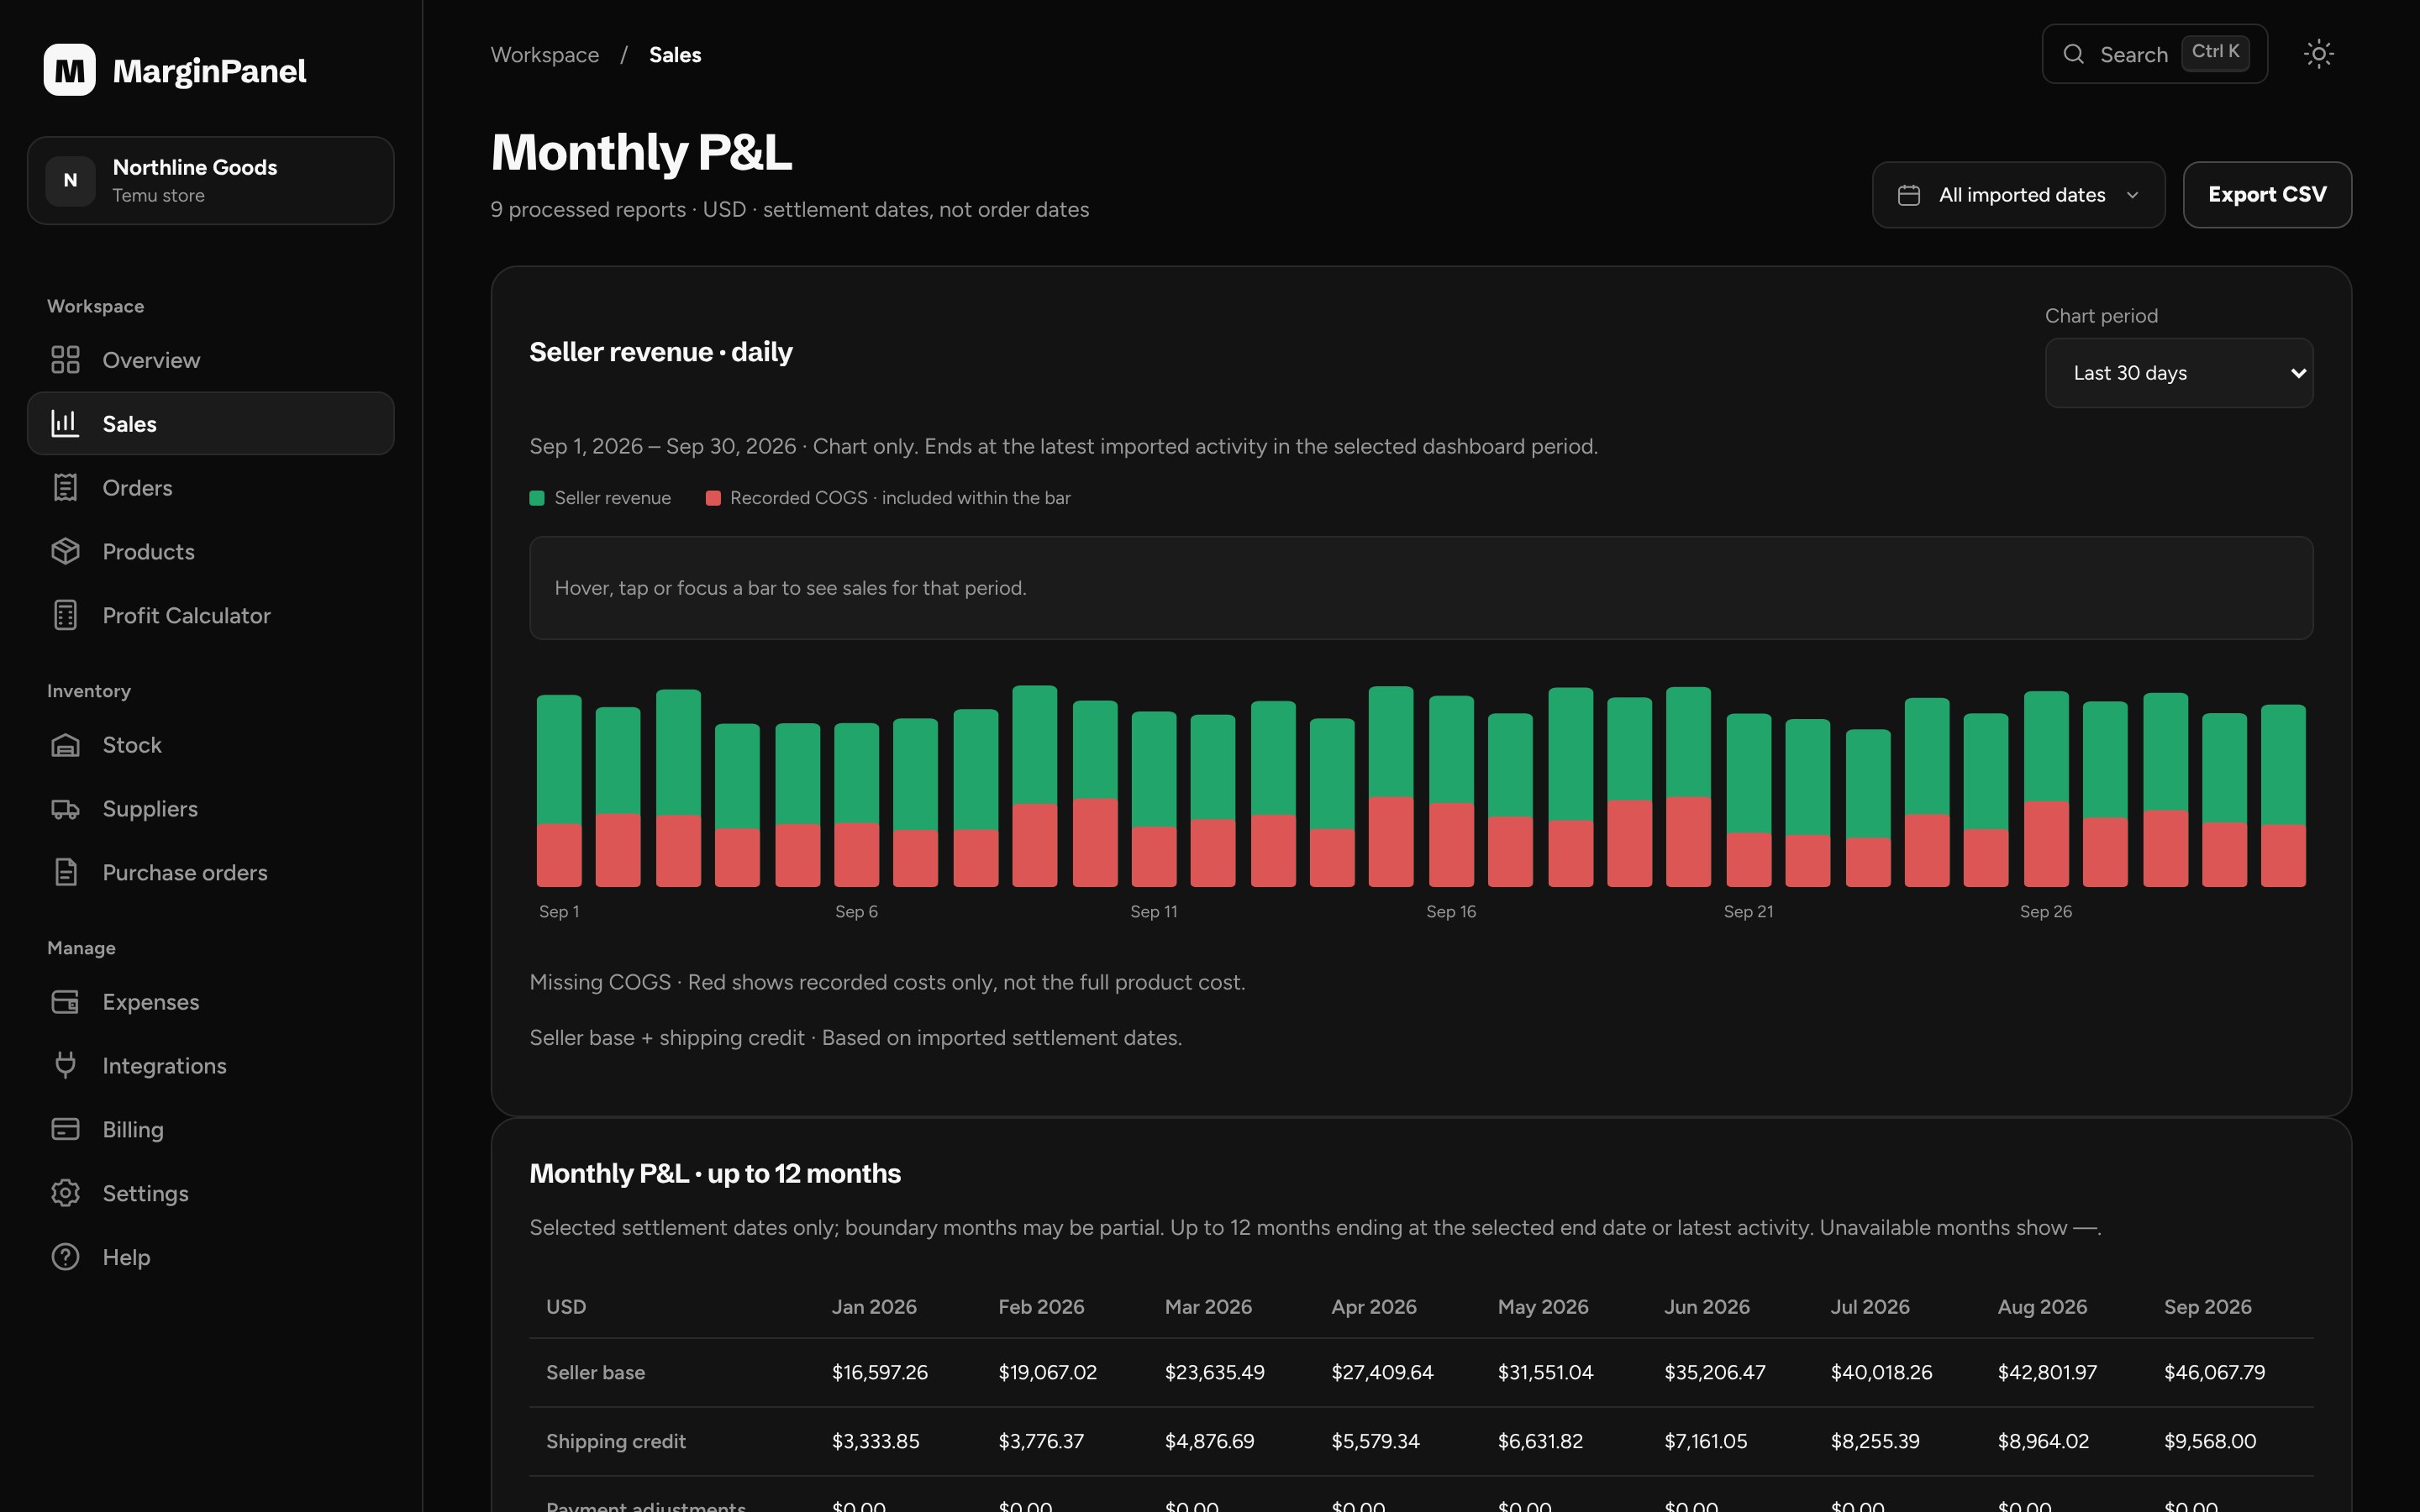
A monthly P&L that ties out to Temu.
Sales, shipping, refunds, labels, ads, adjustments and product cost, month by month.
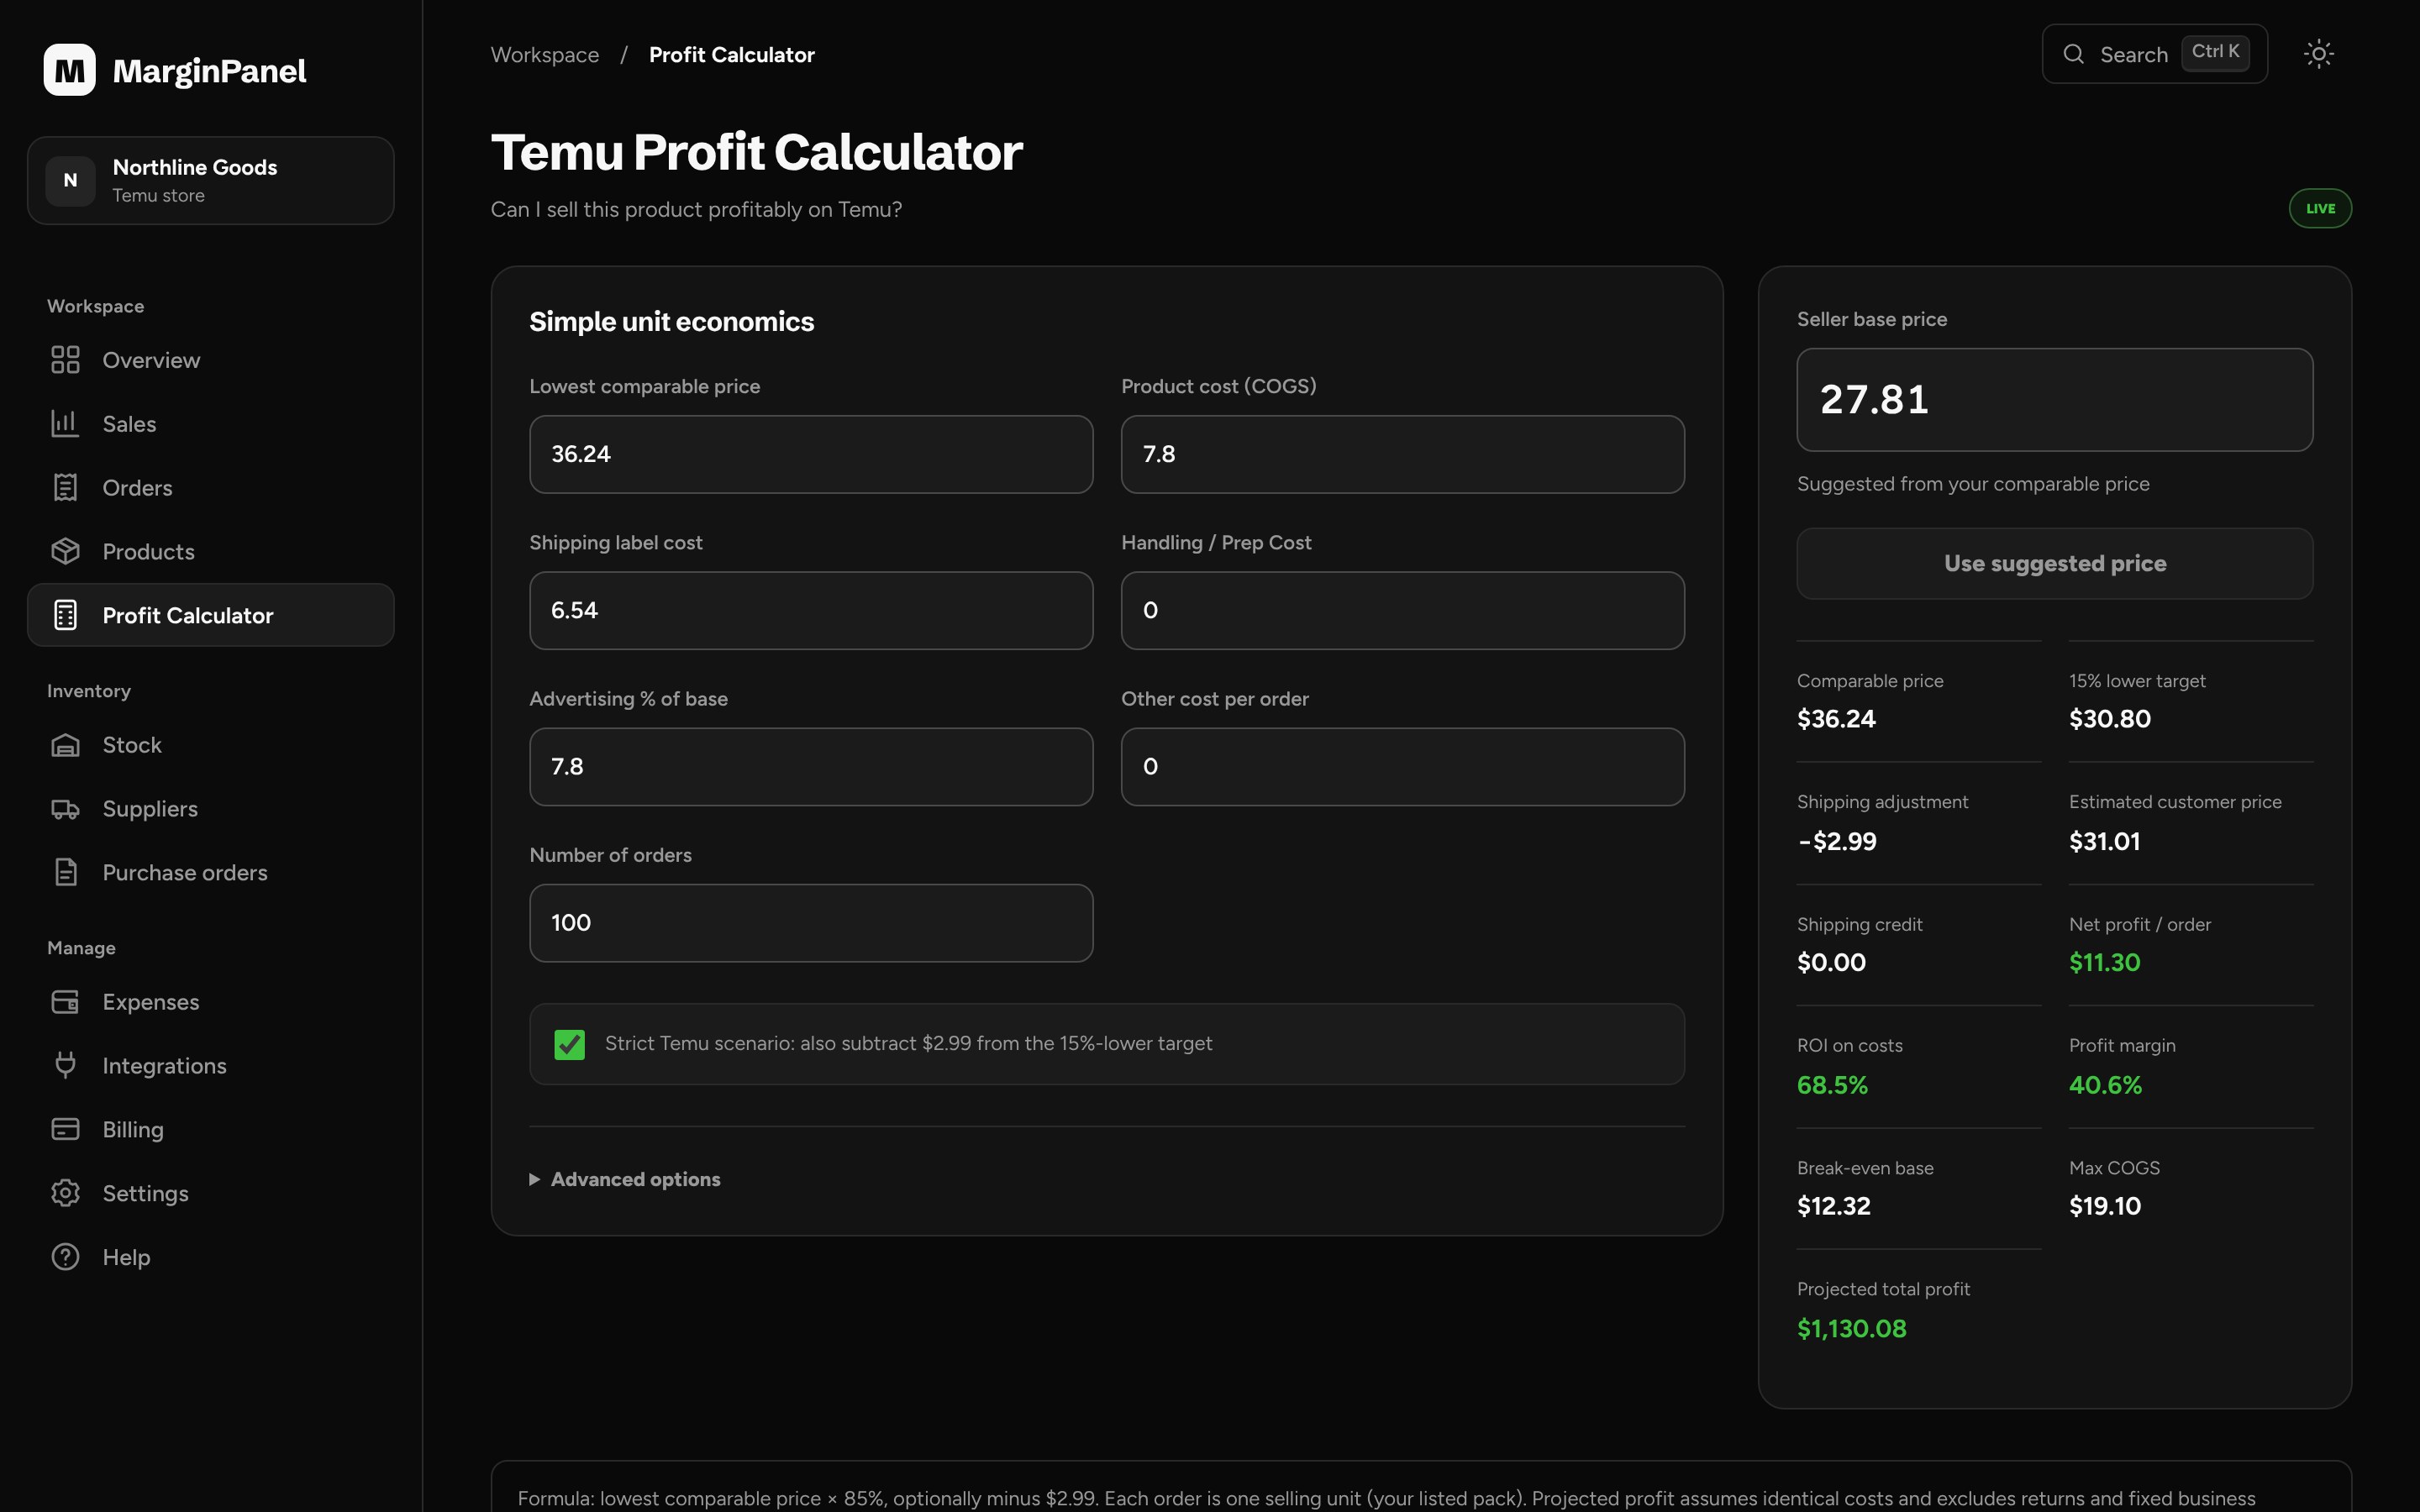
Run the numbers before you list.
Can I sell this profitably on Temu? Enter the lowest comparable price and your costs.
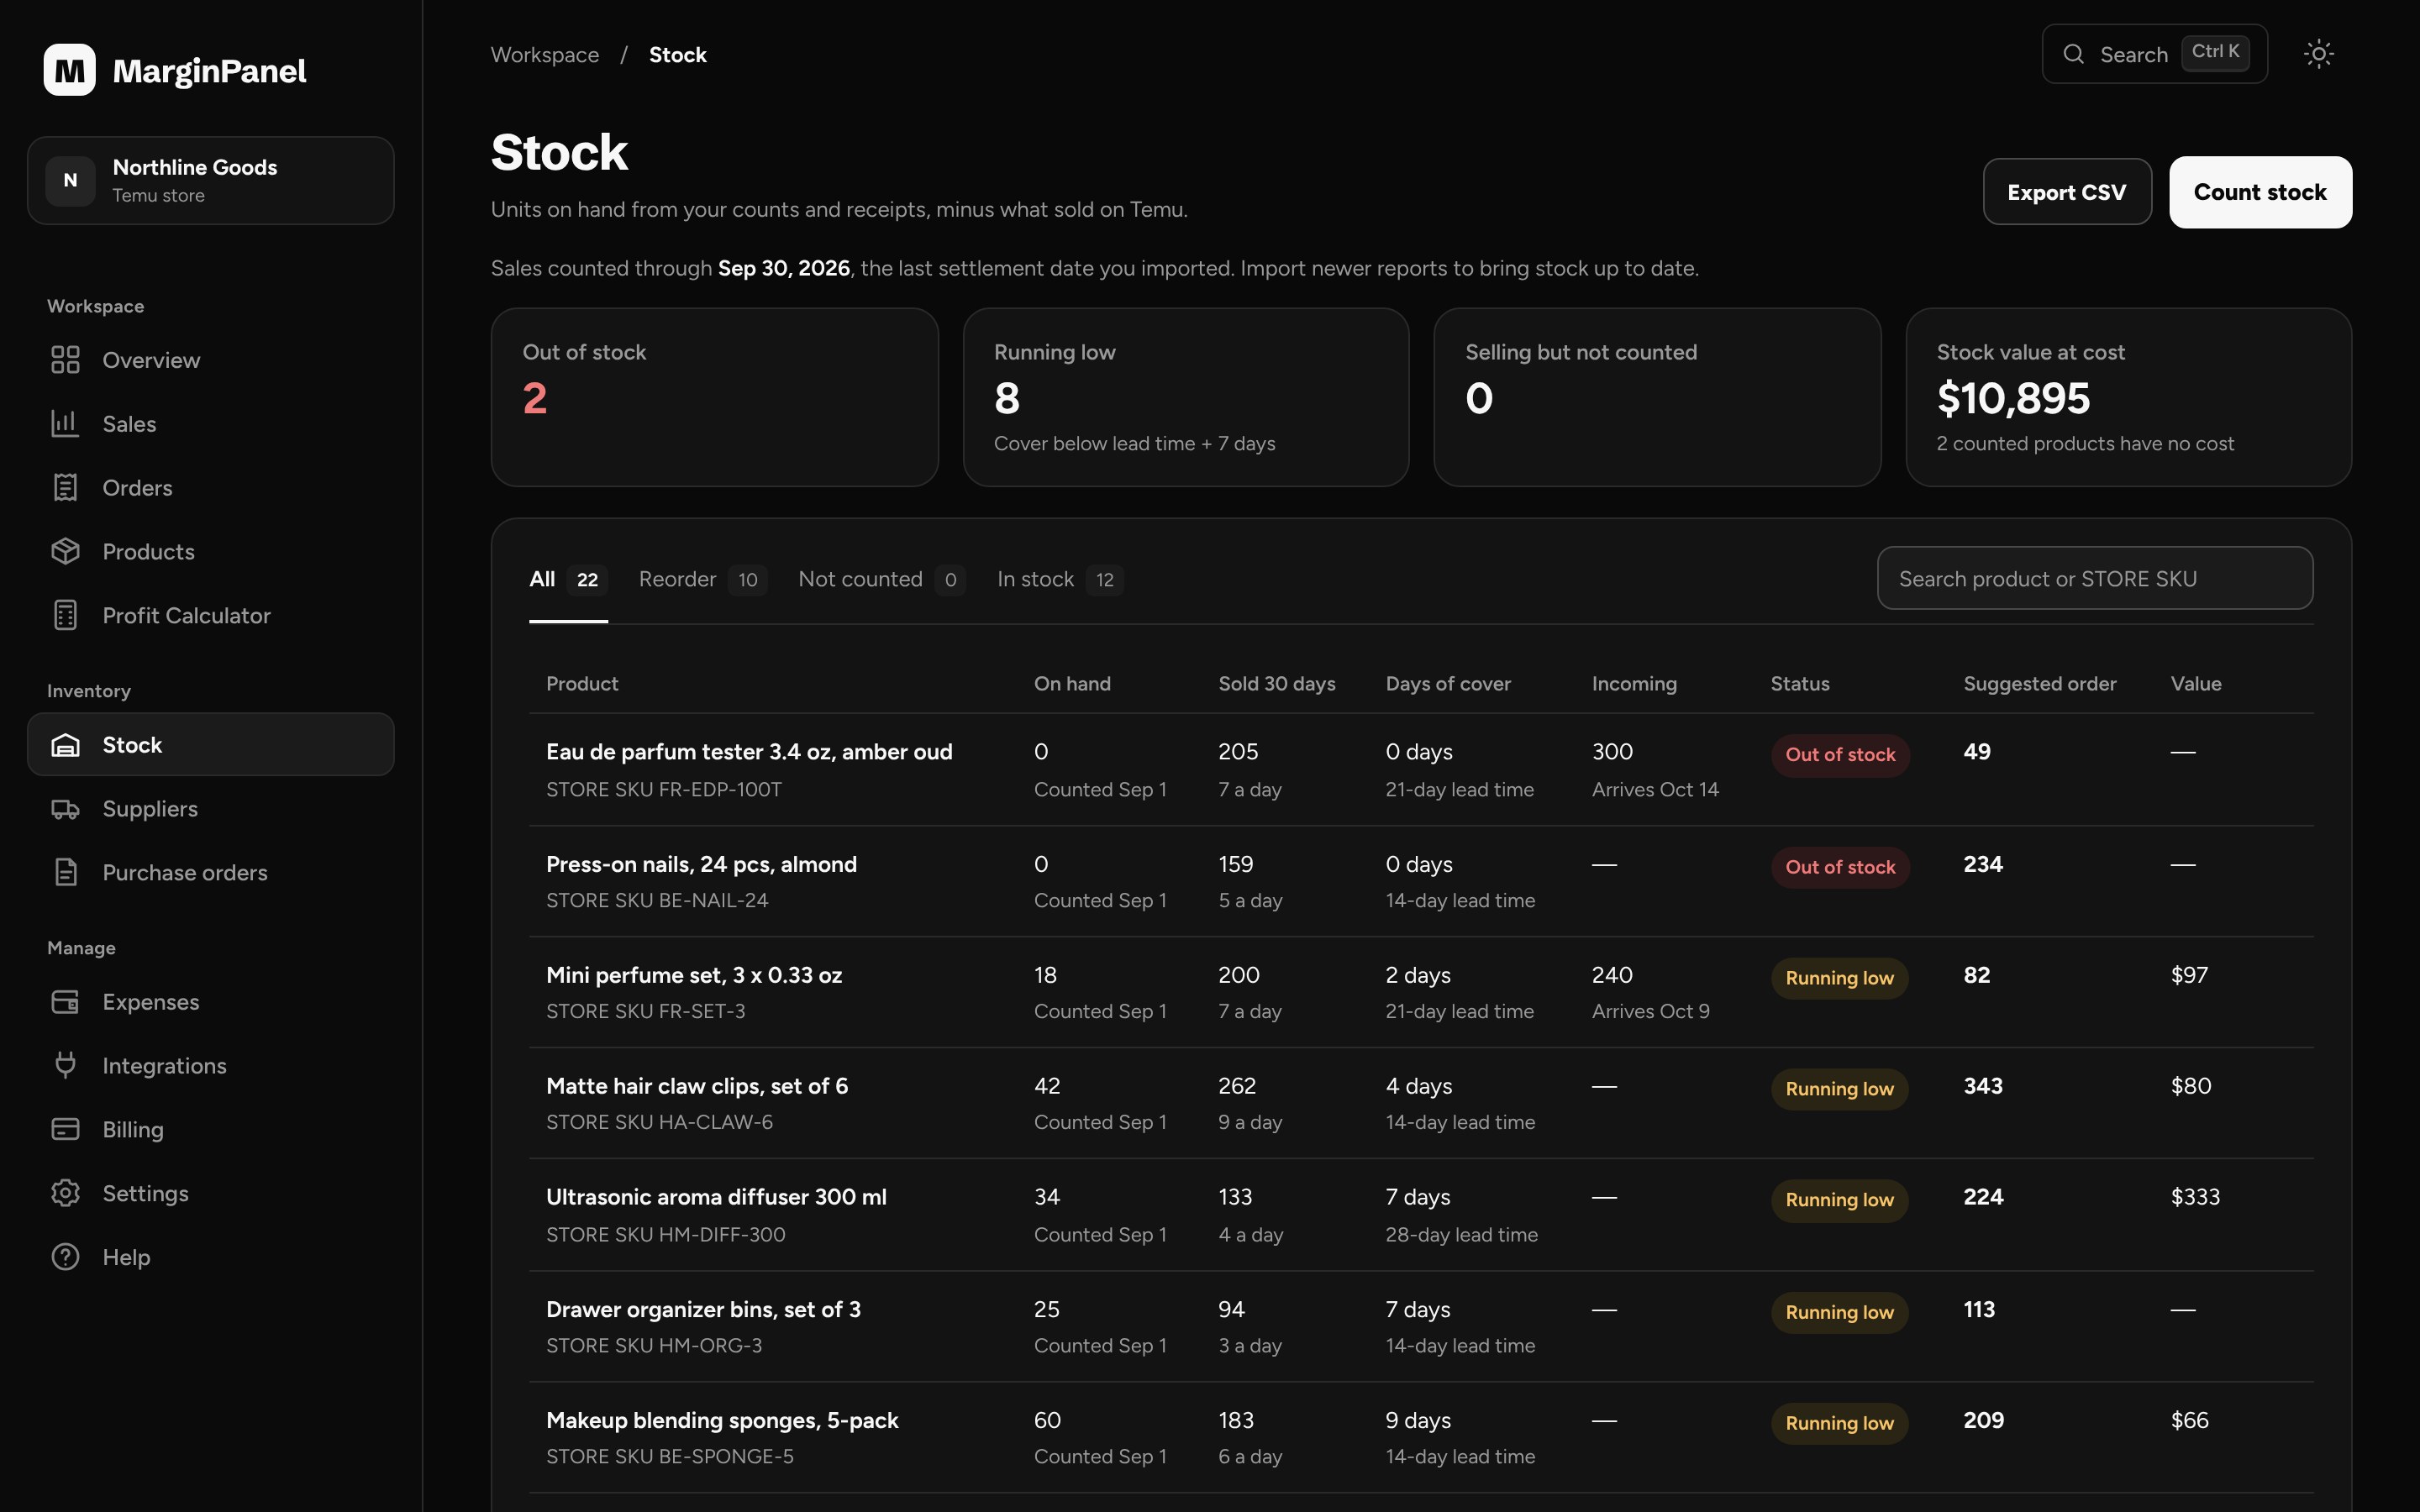
Know when to reorder.
Count your stock once. MarginPanel subtracts what sells on Temu and tells you what’s about to run out.
GOODBYE, SPREADSHEET
What breaks in Excel is already solved here.
Every row in this table was a real problem in our own operation before we built MarginPanel.
| In Excel | In MarginPanel |
|---|---|
| Thousands of mixed rows to sort by hand every month. | Upload the file and every movement is classified and reconciled. |
| Excel turns your SKUs into scientific notation (3.86E+13). | Damaged SKUs are detected and kept intact. |
| Upload the same month twice and your sales double. | Repeated files and overlapping months are blocked. |
| Change a cost and past months get rewritten. | Each cost applies from its date. The past stays the same. |
| Someone edits a formula and nobody notices. | The same calculation every time, down to the cent. |
HONEST NUMBERS
If we don’t know a number, we don’t make it up.
Missing cost isn’t zero cost
If a SKU has no cost, we flag it and show profit as estimated, with how many are missing.
No made-up fees
We start from your base price, which is what Temu pays you. No assumed percentages.
Settlement dates
Figures follow Temu’s dates, so they match what actually lands in your bank.
Private by design
Your reports sit in private storage, and every account is isolated in the database.
BUILT BY TEMU SELLERS
We built MarginPanel for our own Temu store. We had thousands of report rows and one question: how much do we actually keep? Now the answer is ready every time we upload a report.
PRICING
Pay by order volume.
Every feature on every plan. Start with a 14-day free trial.
Starter
Up to 1,000 orders a month
Billed monthly
Growth
RECOMMENDEDUp to 5,000 orders a month
Billed monthly
Pro
Unlimited orders
Billed monthly
Need more users or several stores? Contact us.
FAQ
What sellers ask us.
Do I need to connect my Temu account?
No. You just upload the report you already download from Seller Central. We never ask for your password. Automatic API sync will come once Temu approves access.
Which files does it accept?
Temu’s settlement report in CSV or Excel (.xlsx), up to 25 MB per file. You can upload several months at once.
What if I upload the same month twice?
Repeated files are detected and skipped, and overlapping periods are never counted twice.
Why don’t the dates match the purchase date?
Temu reports by settlement date. MarginPanel keeps that date so your numbers match what Temu deposits.
What if I don’t have costs for all my products?
We calculate with the costs you have and mark profit as estimated, with the number of SKUs missing a cost. We never assume a zero cost.
Is there a free trial?
Yes. Every plan starts with a 14-day free trial, with every feature included.
Can it track my inventory?
Yes. Count your stock once and MarginPanel subtracts what sells on Temu, shows days of cover and suggests how much to reorder. You can also keep suppliers and purchase orders there.
Does it work for Amazon, TikTok Shop or Walmart?
Today MarginPanel is built for Temu.
Is my data safe?
Your reports are stored privately and every account is isolated at the database level. No one outside your account sees your data.